When developing JEE applications these days we not only deploy ‘em as containerized apps but (at least in my teams) also use containers for local development.
One issue I was confronted with the other day was a performance bug with one of our apps. Back in the days I’d have just fired up VisualVM to connect to the local process causing trouble - but now, the process to attach to doesn’t run locally anymore.
JMX pre-requisite
At the end of the day the solution is pretty simple - just treat the containerized process as an external app (i.e. like an app that was deployed on a remote server) and connect to it via JMX. Unfortunately, this can become quite tricky.
Turn on JMX
This activates JMX and binds the JMX-server to port 9090 (why you need to repeat the ports)-Dcom.sun.management.jmxremote -Dcom.sun.management.jmxremote.port=9090 -Dcom.sun.management.jmxremote.rmi.port=9090Turn off authentication and transport-layer security
You should think twice before you turn off those security features. It’s way easier to set things up this way at the expense of security of course. IMHO for my use-cases the threat is negligible:-Dcom.sun.management.jmxremote.ssl=false -Dcom.sun.management.jmxremote.authenticate=false- use JMX locally for debugging purposes
- use it within a kubernetes setup where I forward that port to my local machine and don’t expose the JMX server to others (more on that later).
Anyways, you have to make that decision yourself in the context of your project.
Setting up the IP/Host: This is the tricky part and has sth. to do with JMX on linux (which your container is most probably running). When you execute
hostname -iwithin your container it’ll resolve to an IP-address not know to/resolvable by the outside world. I found two solutions to this issue:- setting the JMX-host explicitly
-Djava.rmi.server.hostname=<CONTAINER_IP>CONTAINER_IPhas to be the external IP-address assigned to the container. So for your local docker environment this would be the hosts address (sth. like192.168.178.33). This approach though is less portable since all of your collegues will have to change that address to match their enviornment. - setting the hostname via
dockerWhen starting your container (either viadocker run --rm -ti --hostname localhost payara/server-fulldocker-composeor plaindocker) you can pass in the hostname the container should have. If you turn that tolocalhostthe container will resolve its hostname to:payara@localhost:~$ hostname -i 127.0.0.1 172.26.0.4 ::1
- setting the JMX-host explicitly
Lets take all this toghether and start a payara/server-full container with active JMX:
docker run --rm -ti \
    -e JVM_ARGS="-Dcom.sun.management.jmxremote.port=9090 -Dcom.sun.management.jmxremote.rmi.port=9090 -Dcom.sun.management.jmxremote.ssl=false -Dcom.sun.management.jmxremote.authenticate=false" \
    --hostname localhost \
    -p 9090:9090 -p 8080:8080 \
payara/server-full192.168.178.22):docker run --rm -ti \
-e JVM_ARGS="-Djava.rmi.server.hostname=192.168.178.22 -Dcom.sun.management.jmxremote.port=9090 -Dcom.sun.management.jmxremote.rmi.port=9090 -Dcom.sun.management.jmxremote.ssl=false -Dcom.sun.management.jmxremote.authenticate=false" \
-p 9090:9090 -p 8080:8080 \
payara/server-fullIn both cases you’d be able to connect to your containerized app via: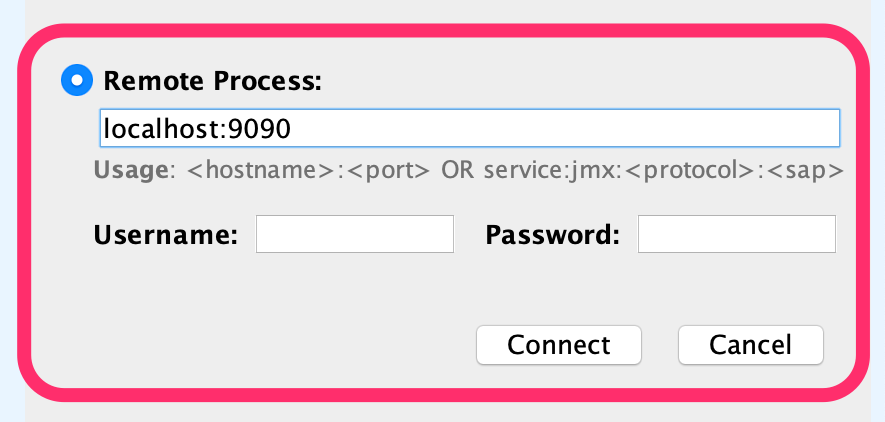
Connecting to pods running on k8s or openshift
So far we just looked at how to connect to a container running in your local docker-host. But when dealing with JMX (and the capabilities waiting beyond, like FlightRecorder and MissionControl) it’s maybe even more interesting to connect to productive applications running in a kubernetes-ish orchestrator (nothing else seems to be relevant anyways).
Assuming you’ve setup the container within the pod to start a JMX-server that binds to 127.0.0.1:9090 (using the means from above) you could forward that port to your local machine with:
kubectl port-forward <POD-NAME> 9090:9090Subsequently, you’re again able to connect to localhost:9090 using JConsole or VisualVM exploring information about the remote container.
Leverage tools now
JConsole
To test the setup just start your container, add a port-mapping for the JMX-port
docker run --rm -ti \
    -e JVM_ARGS="-Dcom.sun.management.jmxremote.port=9090 -Dcom.sun.management.jmxremote.rmi.port=9090 -Dcom.sun.management.jmxremote.ssl=false -Dcom.sun.management.jmxremote.authenticate=false" \
    --hostname localhost \
    -p 9090:9090 -p 8080:8080 \
    payara/server-full
and use i.e. <JDK>/bin/jconsole (which is most probably still part of your JDK-installation) to connect to the respective JMX-socket on localhost:9090 (confirm any security warnings).
VisualVM
jconsole is nice, but the aforementioned VisualVM is able to give us deeper insights.
Unless you’re using GraalVM, your JDK either doesn’t contain VisualVM anymore or it contains an ancient version. It was shipped as part of Oracle JDK until version 8 but was discontinued and is distributed now as independent tool. Since I use sdkman to manage parallel JDK-installations I incidentally already had a GraalVM installation which included VisualVM.
If that is not the case you can download VisualVM as a separate tool or check your package manager (like brew cask install visualvm).
- VisualVM of GraalVM: here it was enough to just start the app from within the
bin-directory:<GRAAL_HOME>/bin/jvisualvm - dedicated VisualVM: since I still had an ancient Mac-Installation of JDK I explicitly had to point it to the correct JDK:
/Applications/VisualVM.app/Contents/MacOS/visualvm --jdkhome ~/.sdkman/candidates/java/14.0.1-zulu
Via Add JMX Connection you can then connect using localhost:9090 to your containerized app again:
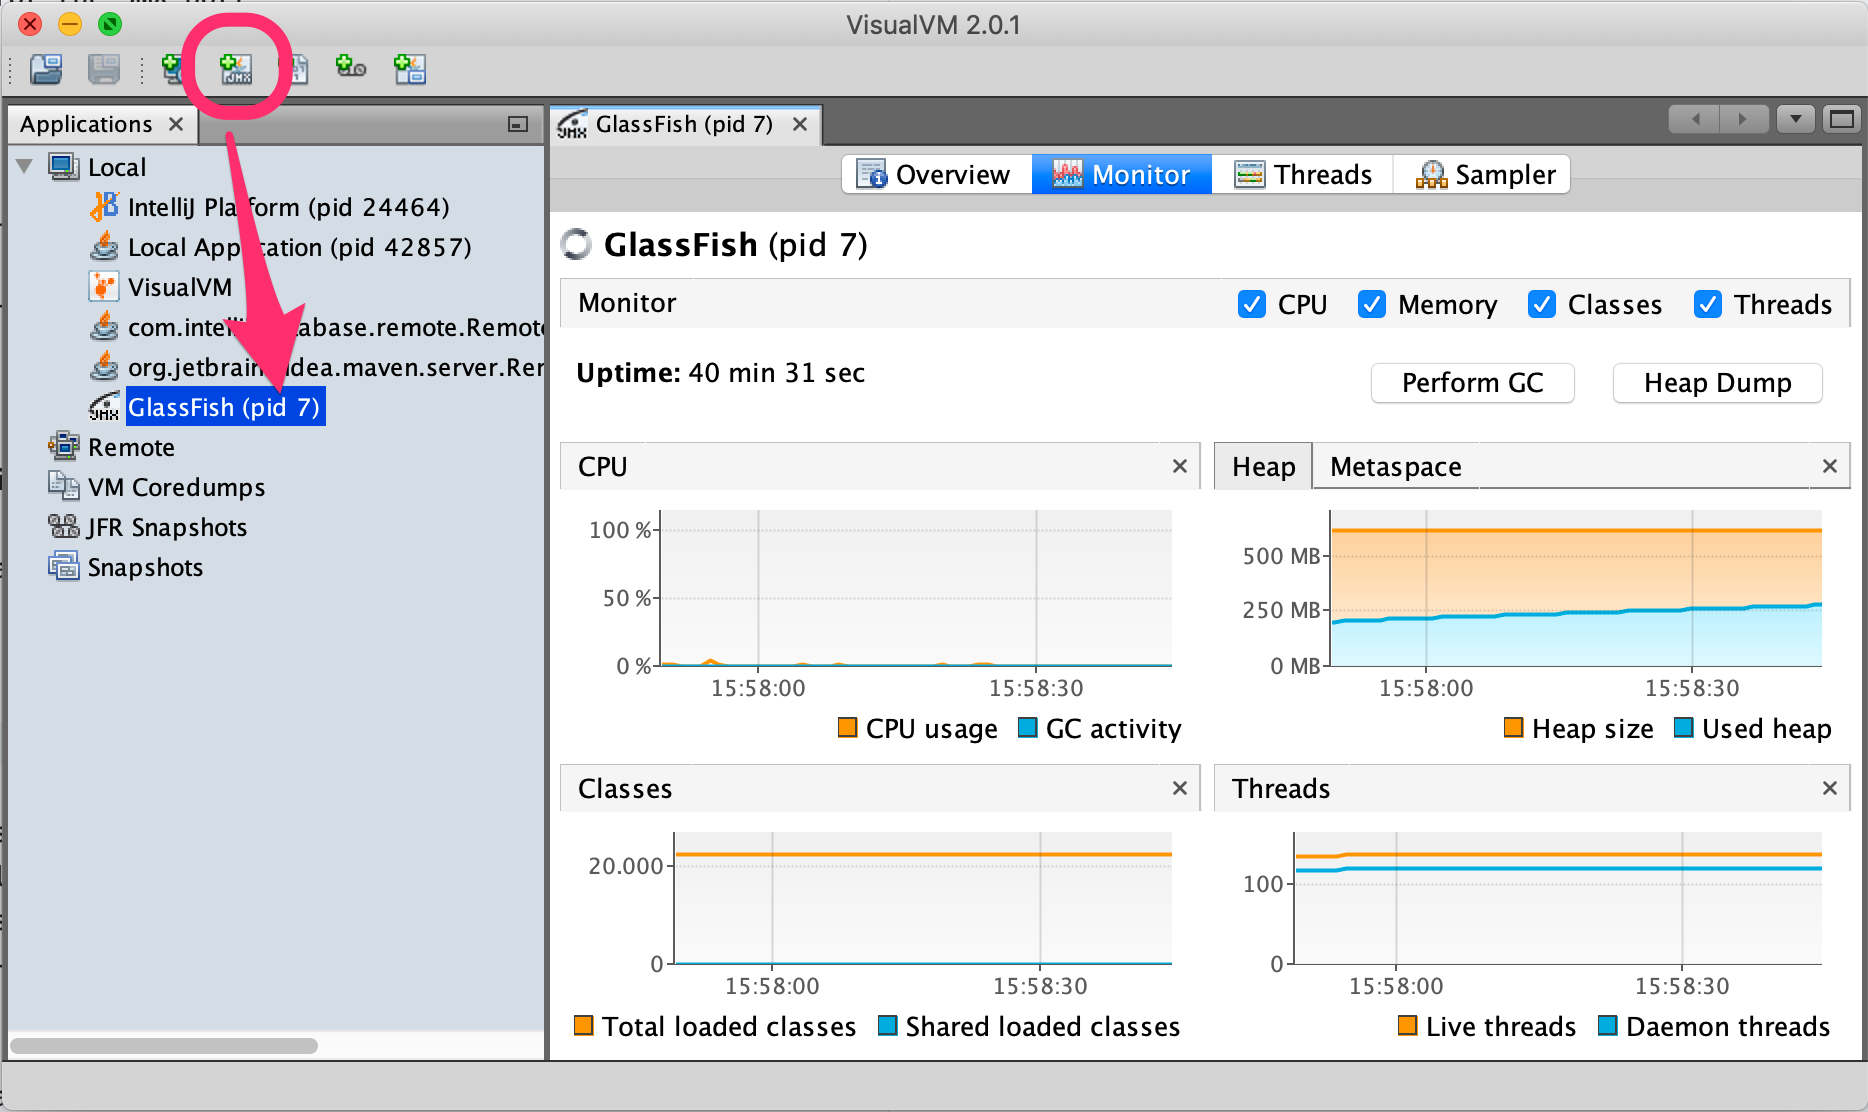
In contrast to JConsole, VisualVM offers a CPU- and Memory-Sampling Profiler which is very useful to identify bottlenecks and general performance hotspots.
Using MissionControl and FlightRecorder
Although using VisualVM most of the time is enough to pinpoint (simple) performance issues I was curious about the integration with MissionControl and FlightRecorder.
Java Flight Recorder is a profiling and event collection framework […] Mission Control is an advanced set of tools that enables efficient and detailed analysis of the extensive data collected by Java Flight Recorder.
The tools are conceived to impose as little overhead to a running application as possible and thus can even be used in production environments - well, and were a commercial feature hence.
Things have changed though and starting from Oracle JDK 11 on FlightRecorder was (along with the actual JDK) open-sourced. Additionally, the guys from Azul backported that feature also to their JDK 8 offering (even for the community build).
… you can use Zulu Mission Control on Zulu Enterprise, Zing, and Zulu Community builds of OpenJDK …
Since in our examples we used payara/server-full which is based on azul/zulu-openjdk we’re able to leverage that tools. So, let’s download and unpack ZMC (Zulu Mission Control).
Just like VisualVM also ZMC had an issue with may ancient Mac-Java - so I had to explicitly point it to a JDK to be used. For that, find the zmc.ini-file (for Mac this is <APP-FOLDER>/Contents/Eclipse/zmc.ini) and add the -vm option:
-vm
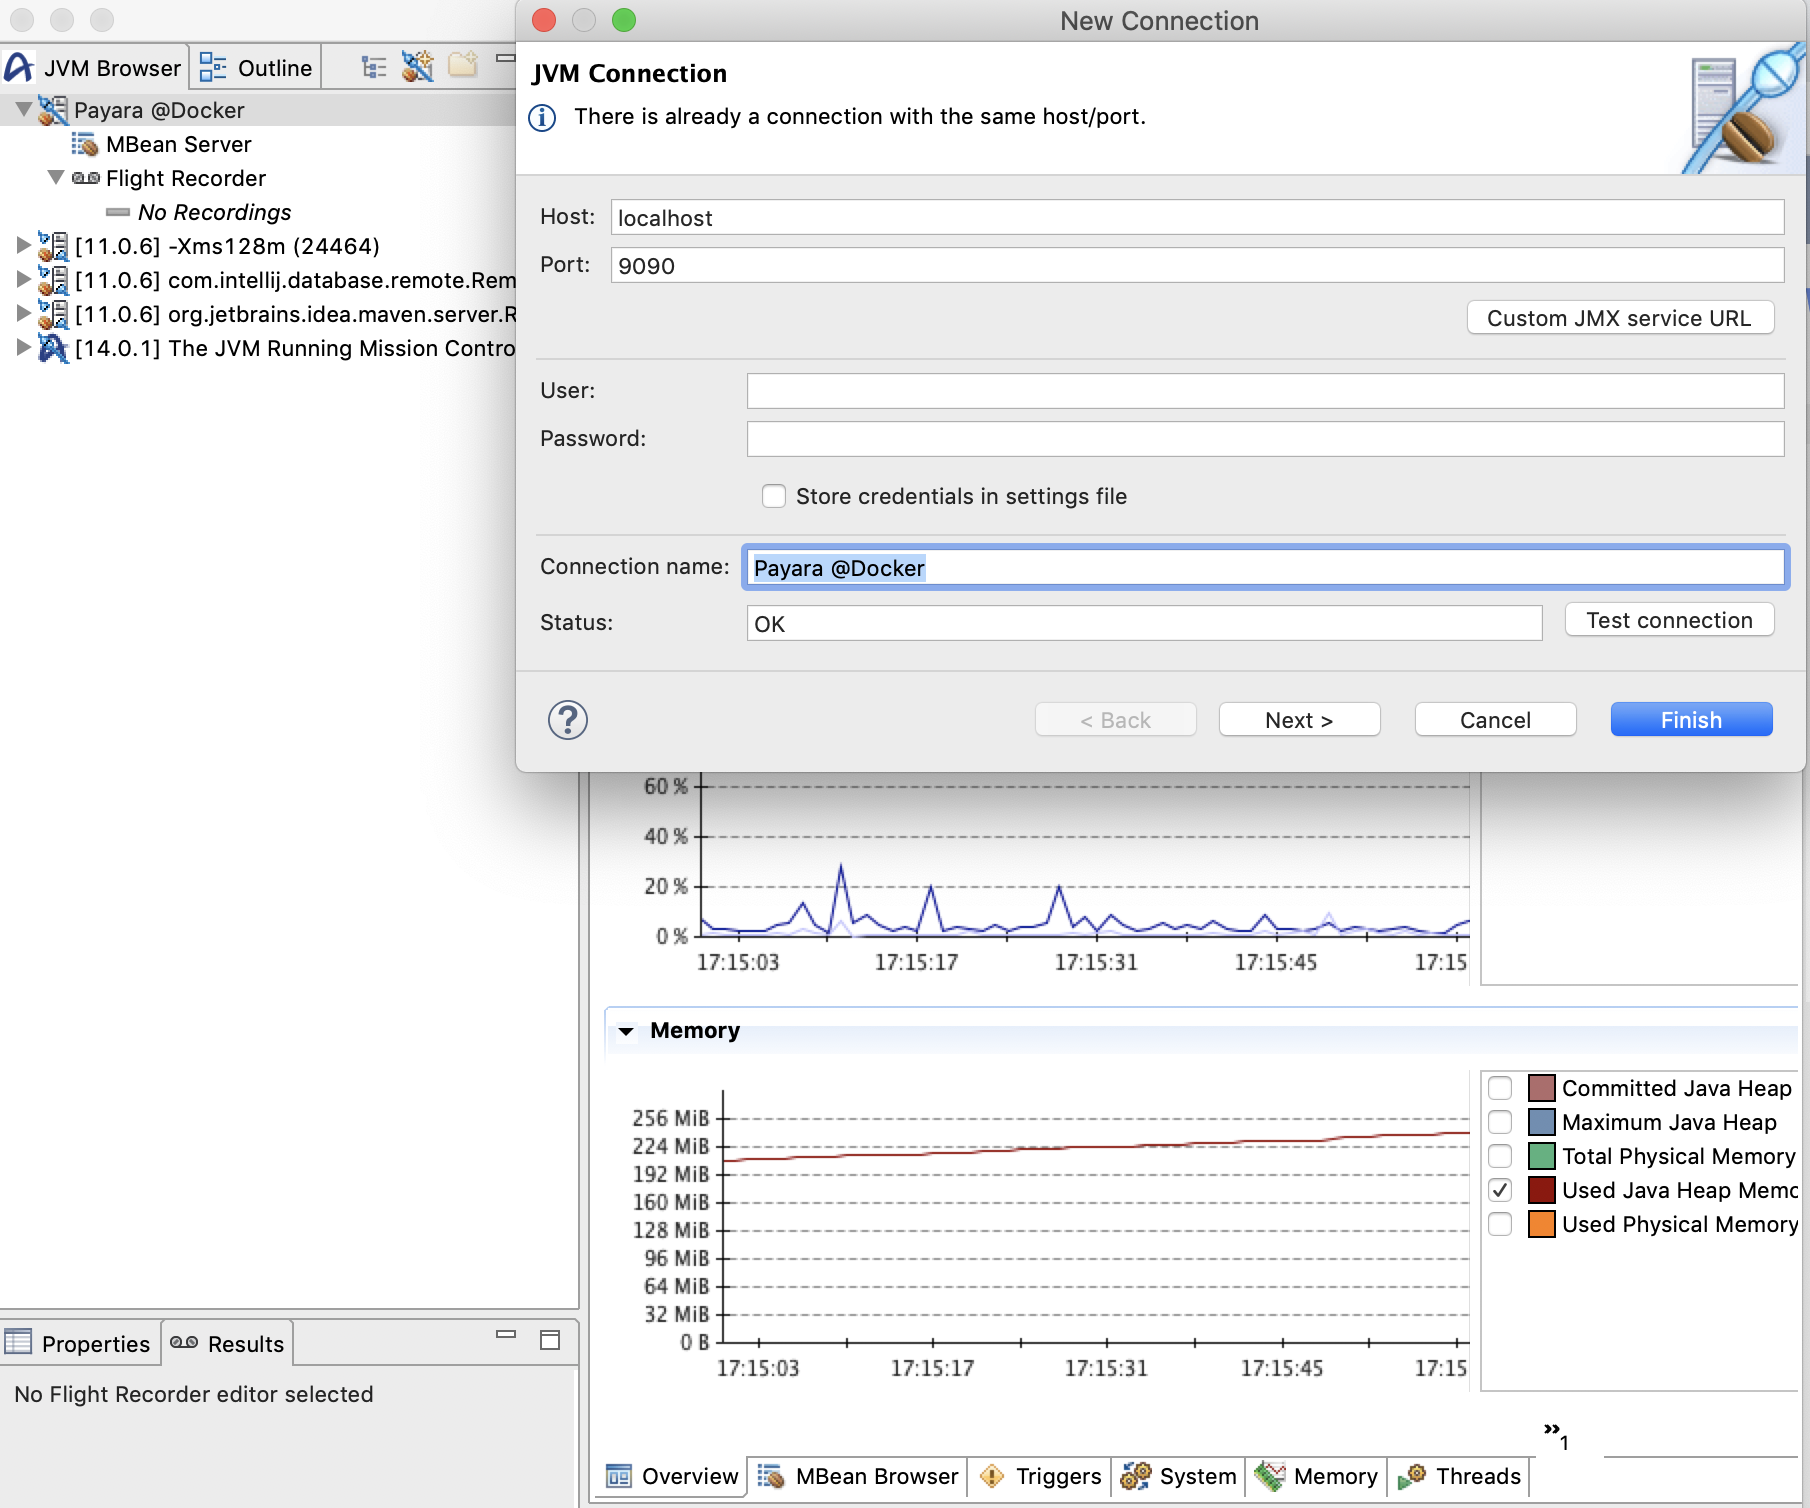
/Users/schoeffm/.sdkman/candidates/java/14.0.1-zulu/binAfter that, start the tool, connect it via JMX to the running, containerized process and have look around
For Zulu-JDK you don’t even have to set -XX:+FlightRecorder anymore to activate the feature since it’s activated by default already. But when working with an application server there are still some JVM-options worth changing/setting to get better results.
-XX:FlightRecorderOptions=stackdepth=2048
-XX:+UnlockDiagnosticVMOptions
-XX:+DebugNonSafepoints
FlightRecorderOptions increases the stackdepth that gets recorded (otherwise stack traces would be truncated) and DebugNonSafepoints (which has to be combined with UnlockDiagnosticVMOptions) improves fidelity as explained here.
You could even start a continous recording that will be started along with the process and that stores its information in a ring-buffer waiting happily for being dumped and analyzed on demand by adding:
-XX:StartFlightRecording=disk=true,name=core,dumponexit=true,maxage=3h,settings=profile To get more information about ZMC and its background have a look at this webinar recording.
Happy troubleshooting!