When revision 2.3 of the microprofile metrics API was release earlier this year it introduced a new metric type called Simple Timer. Granted, with a name like that it’s easy to underestimate this new type - but don’t get tricked by its unspectacular title. Turns out, most of the time (especially in my projects where we also make use of Prometheus) it’s a way better suited and more flexible metric than i.e. its older cousin Timer.
@SimplyTimed - why should I care
The specification itself describes the Simple Timer as:
a lightweight alternative to the timer metric that only tracks the elapsed time duration and invocation counts. The simple timer may be preferrable over the timer when used with Prometheus as the statistical calculations can be deferred to Prometheus using the simple timer’s available values.
which already explains why it is a better fit in a Prometheus-based setup. It only comprises two metrics instead of the fifteen provided by each Timer. Nevertheless, with these two metrics and the usage of PromQL you’re still able to extract a bunch of information.
The issue with Timer is that it offers already aggregated values like rates, standard-deviation or mean-values without giving you the raw, underlying data used for those aggregations. Moreover, those aggregates are provided independently by each microservice instance and it’s problematic to aggregate those instance-specific values up to get a service-wide view - or as Brian Brazil stated it in his phantastic book Prometheus - Up and Running
you could end up averaging averages, which is not statistically valid.
Sounds nice - can I see it action?
I’ve created a small setup where Prometheus scrapes three instances of the same microservice (configured to show different performance behaviour). For easier consumption the scraped data can be visualized by an also included Grafana dashboard.
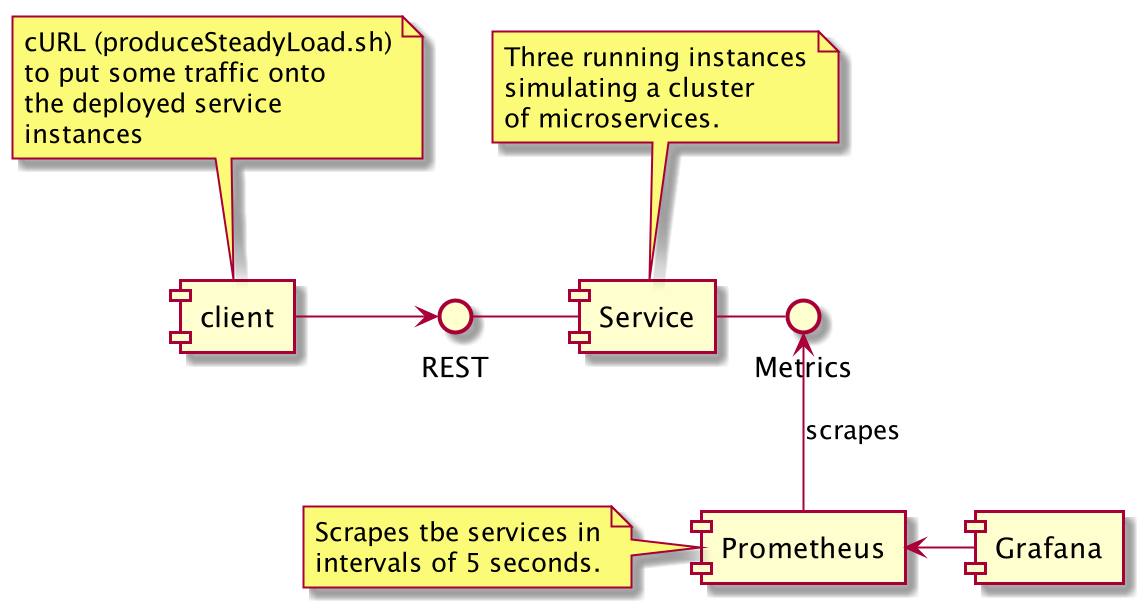
You can build and start the whole stack using the scripts included in the repository:
$> ./buildAndRun.sh && \      # compile, build and start everyth.
   ./produceSteadyLoad.sh     # put some traffic on the services

$> # Grafana:    http://localhost:3000
$> # Prometheus: http://localhost:9090
To setup Grafana you’ll have to login first (using admin/admin and skip any further user-setup). The repository contains a pre-build dashboard you can import - to do this, follow these preparation steps:
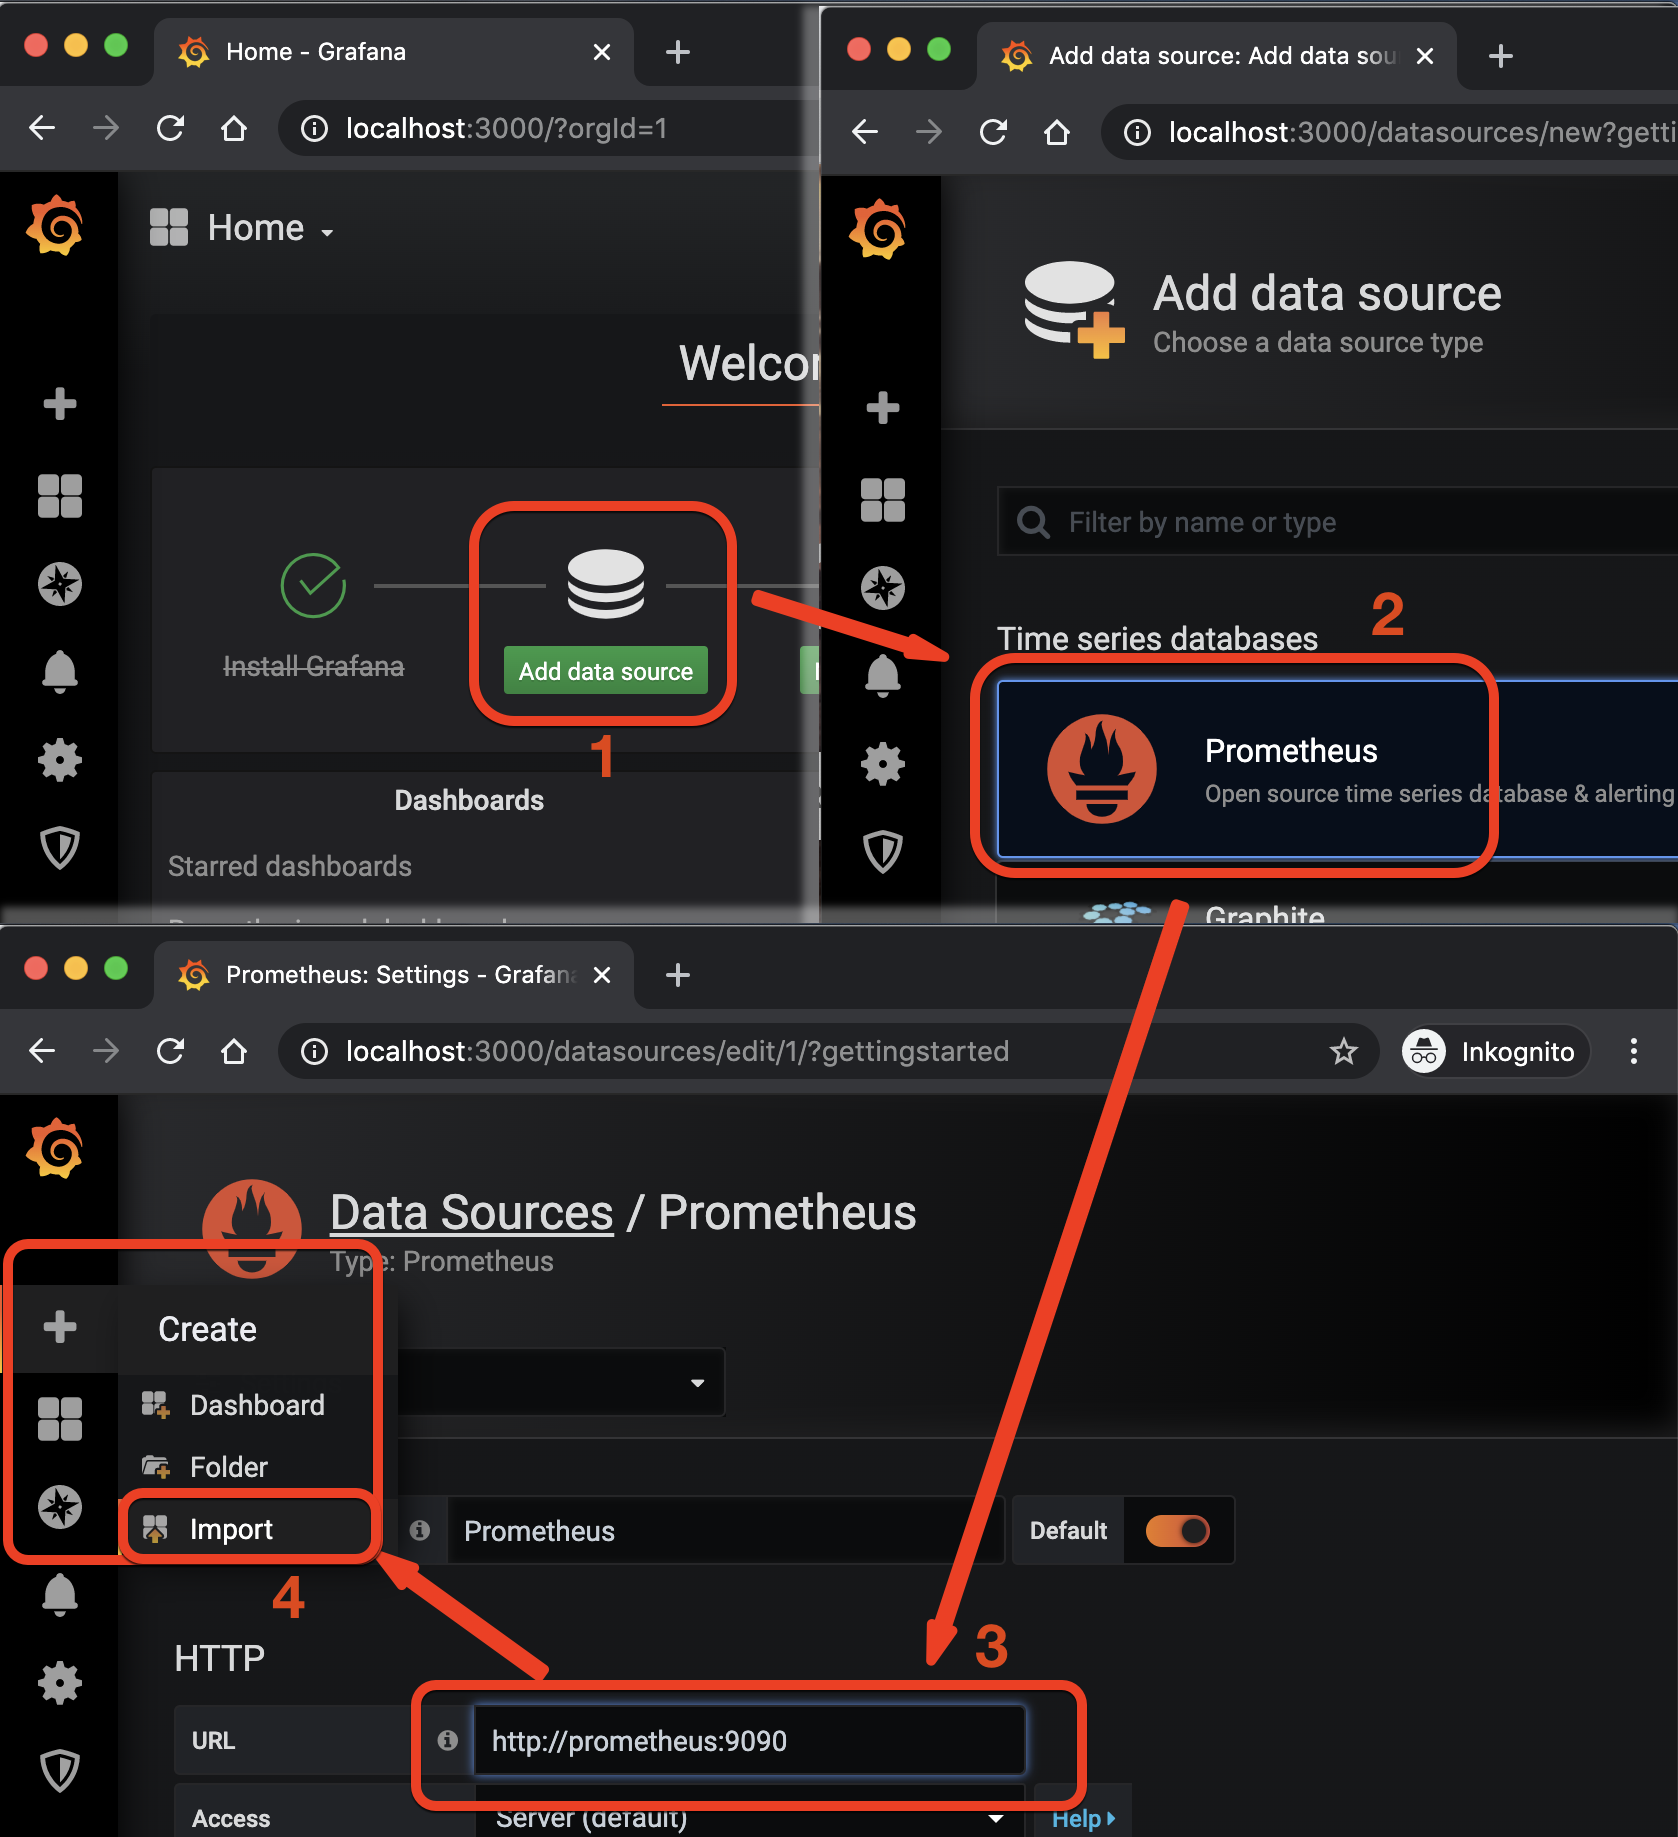
- first, add a new prometheus data source (step 1 and 2)
- the dockerized services can talk to each other via their service names - so prometheus is accessable at http://prometheus:9090 - confirm this dialog via hitting
Enteror the save button at the bottom (step 3) - finally, import the
grafana_dashboard.jsoncontained in the referenced repository (triggered via 4)
Finally, we can play with the data
Well, let’s see what the @SimplyTimed-annotation produces - as I’ve mentioned above there are only two metrics included. For my HelloResource-class and its simplyTimedHello-method this results in:
application_de_bender_metrics_HelloResource_simplyTimedHello_elapsedTime_seconds
application_de_bender_metrics_HelloResource_simplyTimedHello_total
The first one being a gauge (representing the total amount of seconds) while the second one is a simple counter (representing the total number of calls). Both values will constantly increase and are of minor use in their raw form.

To make ‘em more expressive we can apply the rate-function of prometheus. This will show us the change-rate of that specific metric.
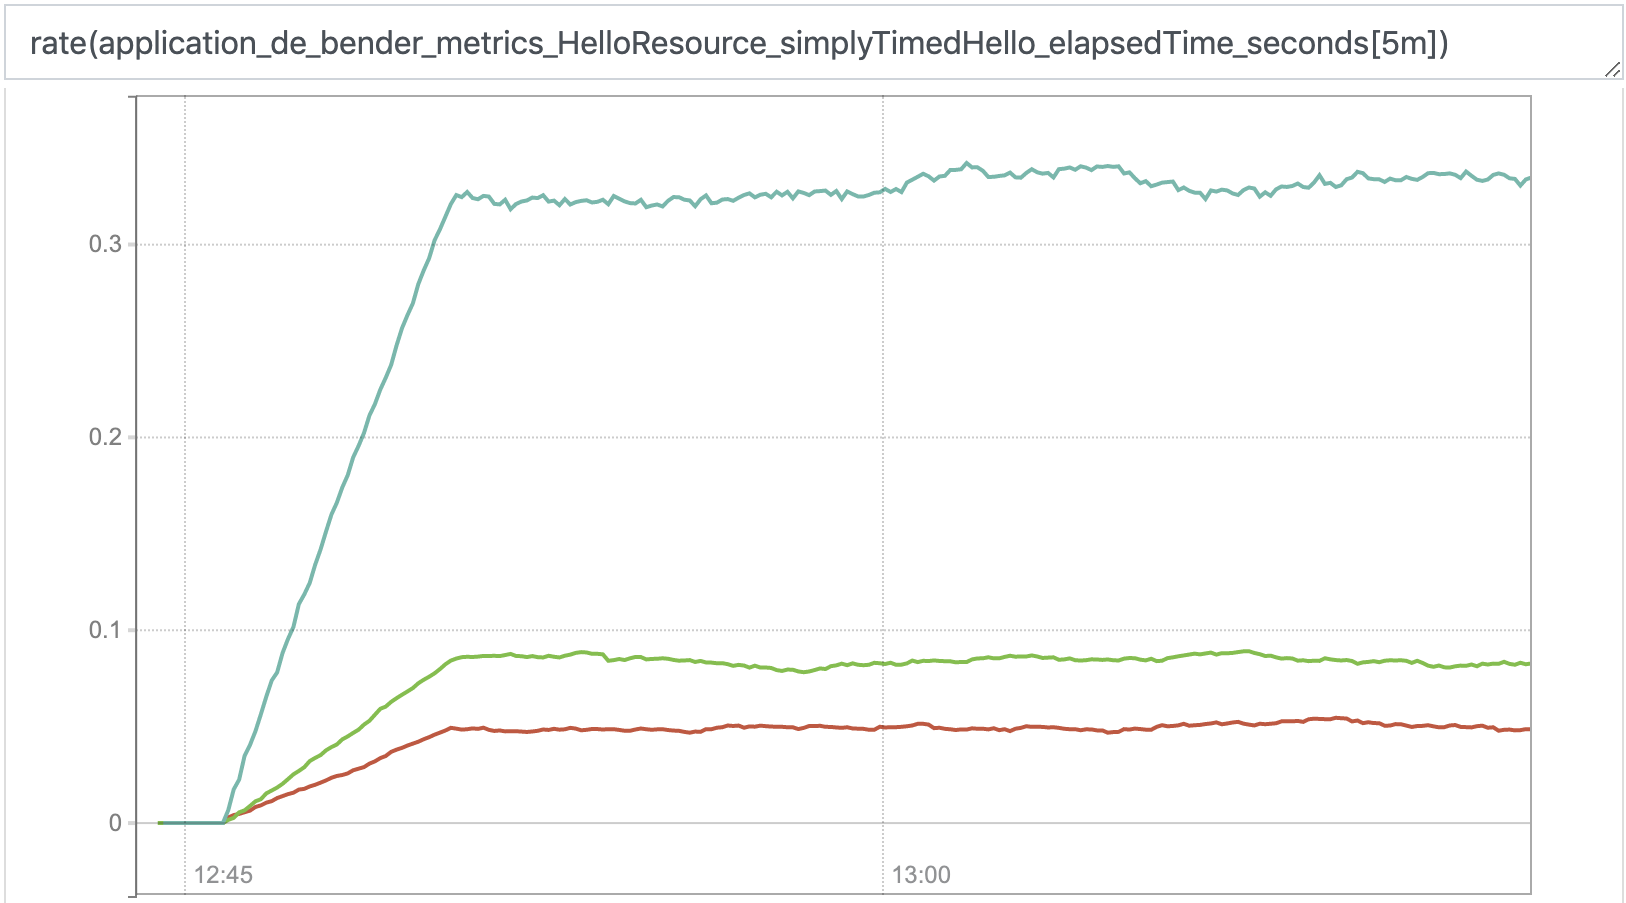
Thought certainly nice, the value of this graph is still doubtful - but represents the foundation of our next step (which is much more useful).
Average response performance (per instance)
As with ordinary average-calculations we can divide the rated elapsedTime by the the rated total amount of calls:
rate(application_de_bender_metrics_HelloResource_simplyTimedHello_elapsedTime_seconds[3m])
/
rate(application_de_bender_metrics_HelloResource_simplyTimedHello_total[3m])
This division matches the time series with the same labels and divides ‘em - resulting in the same three time series stating the average response time over the past 3 minutes as a value:
{instance="service_b:8080",job="service_b"} 0.17564152650602402
{instance="service_a:8080",job="service_a"} 0.09243990722891576
{instance="service_c:8080",job="service_c"} 0.7002928650602409

Now, this representation has real value since it shows us how each microservice is doing in terms of response performance. In our artificial setup one microservice instance performs much worse than the other two instances.
That value by the way serves pretty much the same purpose as Timers *_mean_seconds metrics (Notice: mean and average aren’t necessarily the same thing).
Still, in a microservice landscape a holistic view to the service (not the individual instance) would be more appreciated.
Average response performance (per service)
So, the query from above will produce a result per label set (i.e. service_a != service_b) and thus per individual instance.
Well, if we would now remove that ambiguity by dumping all labels that differentiate the metrics and sum those values up we’d end up in one, aggregated result:
sum without(instance,job)
  (rate( application_de_bender_metrics_HelloResource_simplyTimedHello_elapsedTime_seconds[3m]))
/
sum without(instance,job)
  (rate(application_de_bender_metrics_HelloResource_simplyTimedHello_total[3m]))
And voilà:
{} 0.32279171354972847
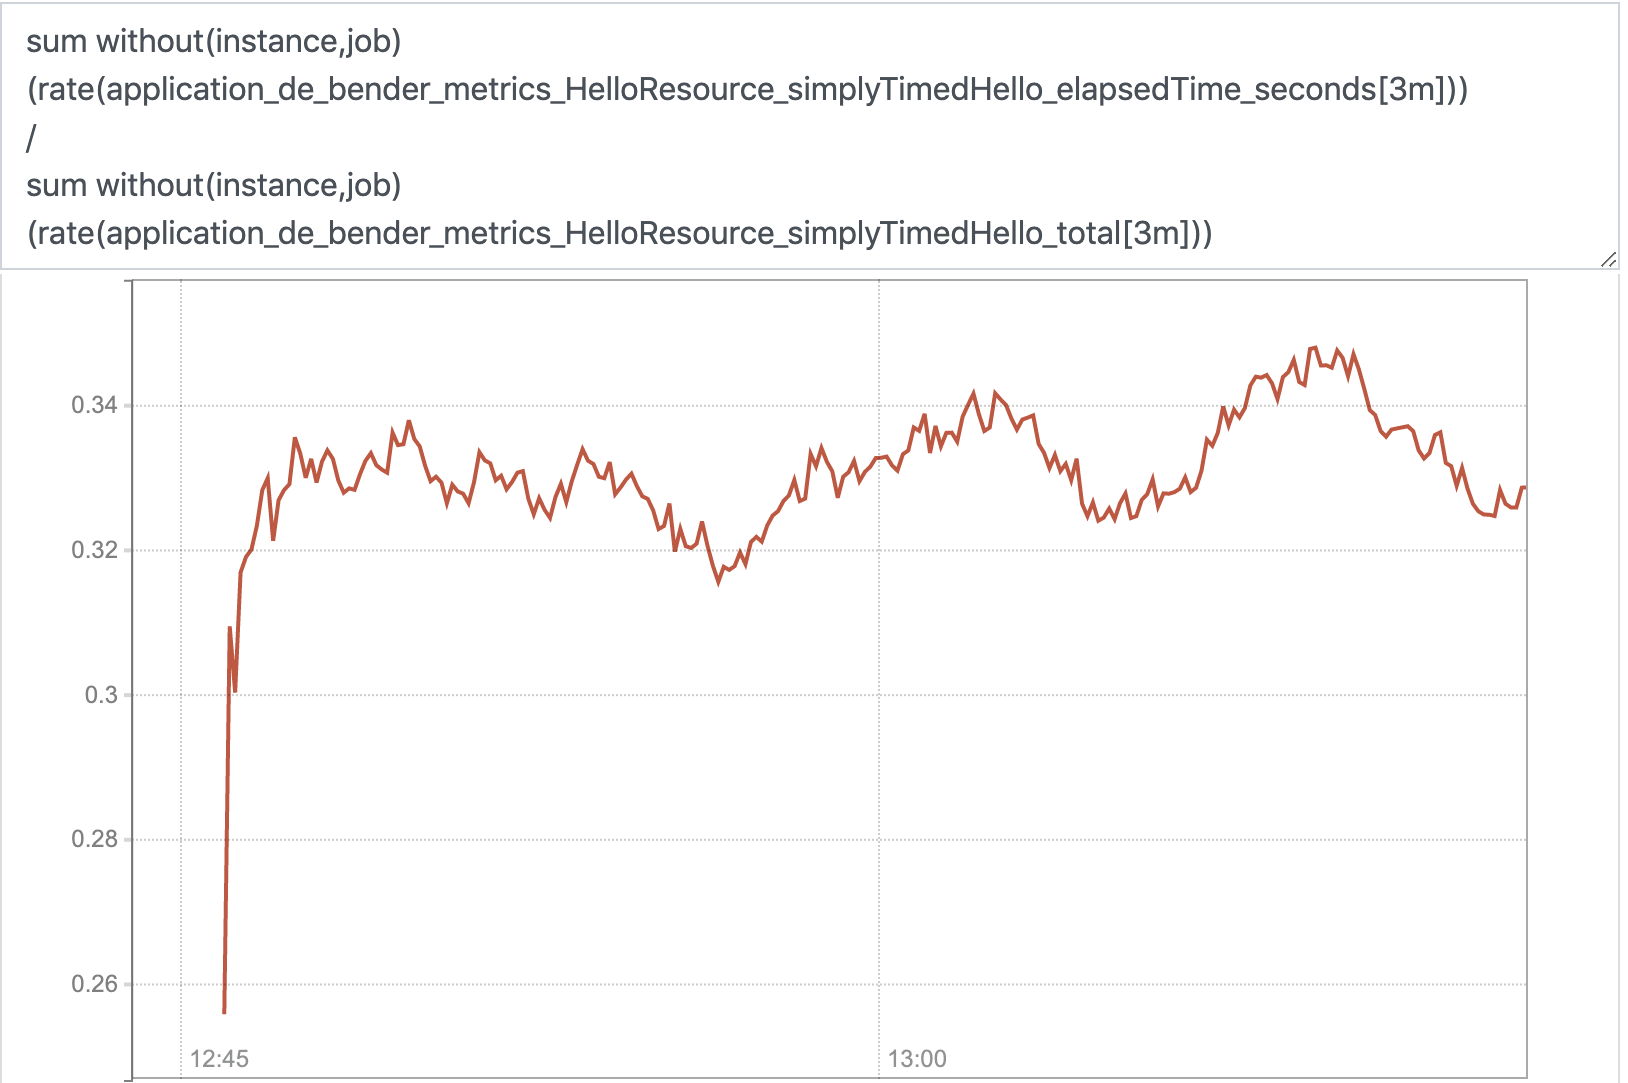
This now represents the average performance of the overall service. That’s also the avg. performance a random user can expect who cannot simply select the most performant service instance but whose request will randomly be routed to one of the cluster members. A nice representative of how well our service is doin’.
Oh and by the way, that value is not reproducable using Timer (without stumbling upon the average of averages issue) since it lacks an _elapsedTime_-pendant.
Conclusion
Simple Timer isn’t just a smaller, simpler version of Timer. In combination with Prometheus it can even be of more use than it’s older brother since it allows us to aggregate values accross JVM-borders (IMHO not applicable to Timer - although the result looks similar to the correct result) which is probably its greatest benefit.